Results Window
Viewing Results as a Grid
Results returned from query execution are displayed in a grid format by default. Results can also be displayed as text, or saved to xml, xls (excel), csv, or written to a database table. You can also display the execution plans (or estimated execution plans) for your SQL scripts as a grid, by pressing the grid icon  in the results window. Please refer to the Execution Plans section to find out more about displaying the SQL server execution plans.
Viewing Results in Text Format
Result sets and execution plans can be viewed in the results window of the editor as text by pressing the View as Text icon  . When viewing query results as text, columns and rows can be copies and later pasted by selecting the text in the results window.
Viewing as Diagram
The View as Diagram button is provided in the results window to allow you to return to the diagram-display of execution plans after you switch the view to either a grid view or a text view. Please refer to the execution plans documentation for additional information regarding executiom plan display options.
Group By Box
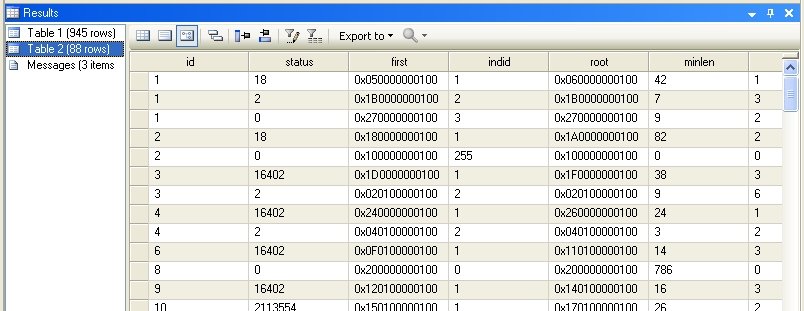
Grids displayed in the results window can be grouped by values of one or more columns. To demonstrate the Group By feature consider the results presented in the following grid.
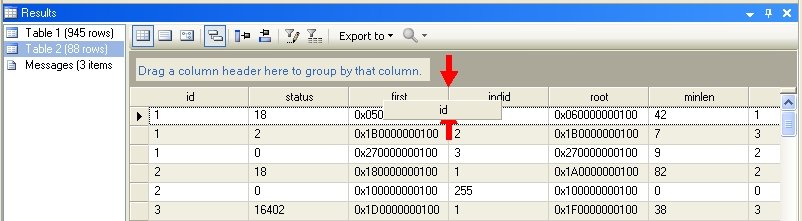
To invoke the Group By feature you must first click the Group By Box icon  . Next, a header will appear above the data grid asking you to drag and drop the columns that will be used to group all row entries.
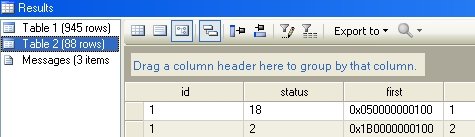
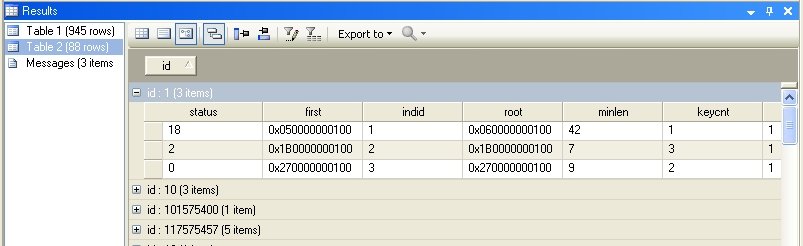
In this example, assume that we wish to group the results by the values of the [id] column, and then by the values of the [status] column. To do so, we must first drag and drop the [id] column header and drop it on the “Drag a column header here” statement.
The outcome of the drag and drop is the grouping of the grid based on the values in the [id] column, as shown below. Note that for each group, the value of the [id] column is displayed at the top of the group.
If you wish to group the results by values of other columns then the same drag and drop operation should be repeated. You can drag additional column headers and drop them on the right hand side of the [id] column to ensure that results are first grouped by the [id] column and then by the additional columns selected.
Ungroup Results in the Grid
If you previously grouped the results presented in the grid, you can return to the original ungrouped display by clicking the Group By Box icon . Another way of returning to the ungrouped view is by dragging and dropping the column headers above the grid back into the grid. For more information about grouping grid results please refer to the Group By Box documentation.
Changing Column Order in the Results Grid
You can change the order of columns displayed in the results grid by dragging and dropping the column header to the new desired location. For example, dragging the [id] column in the figure below will make it the third column from the left in the grid display.
Selection Mode – Selecting Columns in the Grid
When you click a column header in the results grid, one of two actions can take place: (i) The entire grid will be sorted based on the values in the selected column; or (ii) All the cells under the selected column header will be selected.
In order to select all the cells under the clicked column, the grid must be in Selection Mode. In other words, the Sort icon  should not be highlighted/selected. Selection mode then allows you to select the column rows and copy-paste them into other files (excel or text files, for example).
Sorting Columns in the Grid
When you click a column header in the results grid, one of two actions can take place: (i) The entire grid will be sorted based on the values in the selected column; or (ii) All the cells under the selected column header will be selected.
Sort Mode allows you to sort the grid according to the values of one or more columns. To turn it on, click the Sort icon and make sure that it is highlighted/selected. In this mode, columns cannot be copied and then pasted into other files (excel or text files, for example). To enable copy-paste features the grid must operate under Selection Mode. To learn how to sort the grid, please refer to the section titled Sorting Column Values in the Grid.
Sorting Column Values in the Grid
You can sort the results in the grid according to the values of one or more grid columns. Before sorting, make sure that the grid operates in Sort Mode. Once in Sort Mode, pressing the column header will sort the grid in an ascending order of its values. Pressing the same column header again will reorder the grid in a descending order. You can also order the grid entries according to values of additional columns by clicking the SHIFT key and pressing other column headers.

Copy-Pasting Grid Columns and Rows
You can copy paste columns and rows from the grid to excel, text, or any other file types. To copy-paste rows, simply select the one or more rows you wish to copy and paste them directly in the target file. If you wish to copy and paste columns you must first make sure that the grid operates under Selection Mode, by right-clicking the grid and choosing Selection Mode from the menu. Once this mode is verified you can select one or more columns and copy them into the desired file. Finally, keep in mind that you can also export the grid results into an excel file or a csv file instead of copy-pasting the grid entries.
Fixed Column Indicators (Pinning Columns in the Grid)
You can pin one or more columns in the grid to fix their position while browsing other columns in the result set. To use this feature, first enable the column pinning by pressing the Fixed Column Indicators icon  . A pin icon will then appear in all column headers. When the column header pin is displayed horizontally then the column is not yet pinned. You can pin a column by pressing the pin icon on the column header. Pinned columns will then be moved automatically to the left of the grid display and you can use the scroll bar to navigate and view the entire grid content while maintaining the position of the pinned columns. For example, consider the grid display in the image below.
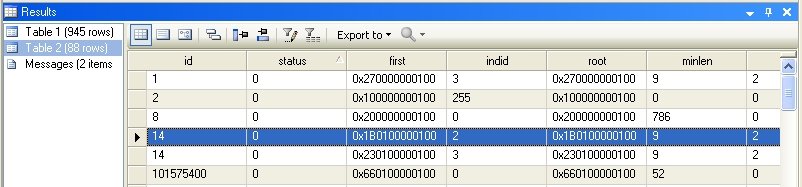
Invoking the pinning feature by clicking the icon and pinning the [status] and the [indid] columns is demonstrated in the image below. The location of the two pinned columns will remain fixed even when scrolling to the right to view additional grid columns.

You can unpin each column by pressing the pin icon at the column header. You can also unpin all columns by pressing the icon .
Fixed Row Indicators (Pinning Rows in the Grid)
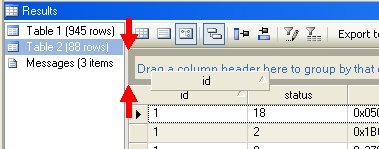
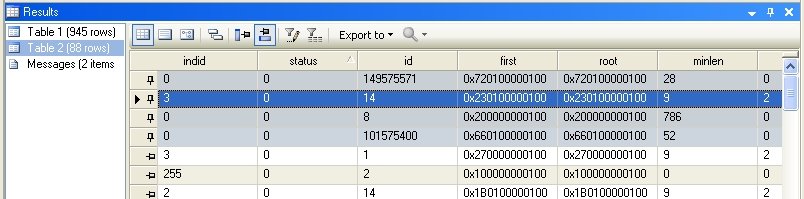
If the grid contains a large number of rows and you wish to scroll down while still being able to view some selected rows, you may do so by using the Fixed Row Indicators feature. Press the Fixed Row Indicators icon  to activate this feature. Once pressed, a pin icon will be placed next to each row in the grid. When the pin is displayed horizontally then the row is not pinned. Click the pin icon for each row you wish to pin. The pin icon will be displayed vertically for every pinned row.
Filtering Rows
If you only wish to view rows that meet some search criteria, you can activate the row-filtering feature by pressing the icon  . Once pressed, under each column header you will see the filtering features. If you hover over the newly added filtering symbols, you can press the checkmark icon to view all the column values in the grid and apply a desired filter. Selecting a single column value will update the grid to only show rows with the selected value for that column. In addition you can select the Custom option to compose a custom filter that may use regular expressions and other advanced filtering techniques.

Exporting Grid Results
Results displayed in a grid can be exported to a database table, a xls excel file, a csv file, or an xml file. Press the Export To icon  to view these options in Combine. While exporting the content of the grid to a file is simple and self-explanatory, the process of exporting the grid results to a database table is explained below.
After selecting the Export to Table option, the following dialog will appear and will ask you for the database and server name in which the table should be created. You can either select a server from drop-down list, or alternatively enter a server name manually. If you need to specify a server port, you can enter it after the server name separating by comma. You should then enter the authentication type that will be used to register all the selected servers. Available authentication types are Windows Authentication and SQL Authentication, and Login name and password will be required if you are registering the servers using SQL Authentication. These credentials will be stored using strong encryption techniques to prevent others from viewing your credentials.
Also you are able to modify all SQL server connection options using Advanced button.
In this dialog you must also enter the table name. If a table with the same name already exists on the target database then you can direct Combine to drop the existing database table so that a new table with the grid results will be created instead.
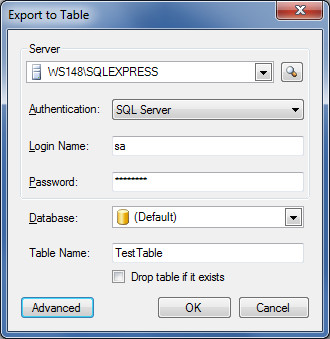
Press the Next button when you are done. The requested table will the be created on the target database.
Execution Plans – Displaying Actual or Estimated Plans
Combine allows you to retrieve the estimated execution plan for a given script. In addition, you can also view the execution plan used by the server after a script has been run. Execution plans can be viewed as a flow diagram, as grids, or in text format. Once a script is available in the editor window you can view the estimated execution plan from the main menu by selecting Query → Display Estimated Execution Plan, or by pressing the CTRL+L shortcut. Then, the estimated execution plan will be displayed in the results window, as demonstrated in the figure below.
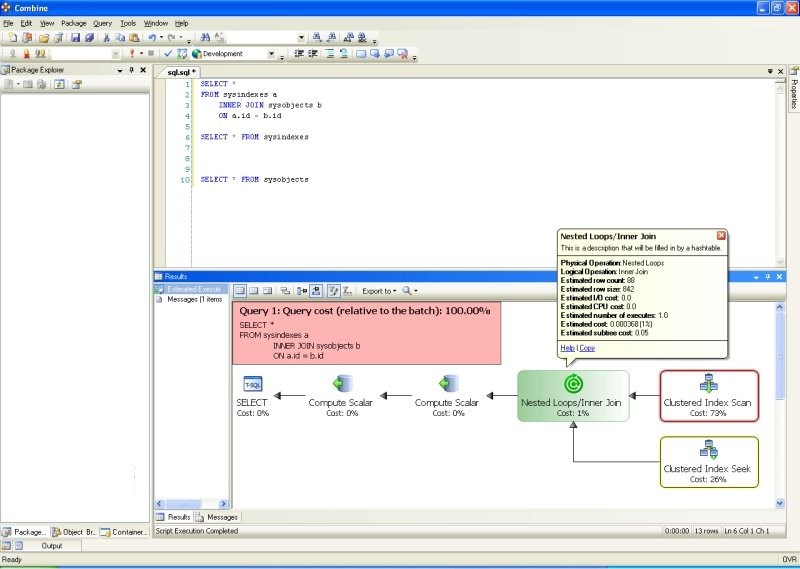
Execution plan actions with cost between 50% and 100% are displayed with a red frame. Yellow frames are used to denote action cost between 25% and 50%. Furthermore, you can hover over each action in the execution plan to view all the details regarding each task. These features also apply when viewing the actual (i.e., not estimated) execution plans. If you wish to view the actual execution plan when running a script or queries, you may do so by select Query → Include Actual Execution Plan from the main menu, or you may press the shortcut keys CTRL+L instead. The actual execution plan will be displayed once the results are returned from the server. Execution plans can also be produced when running a single script against multiple databases, in which case multiple execution plans will be displayed.
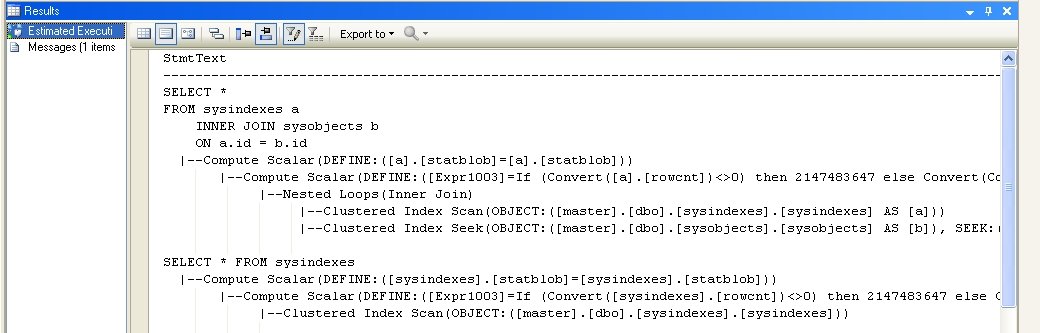
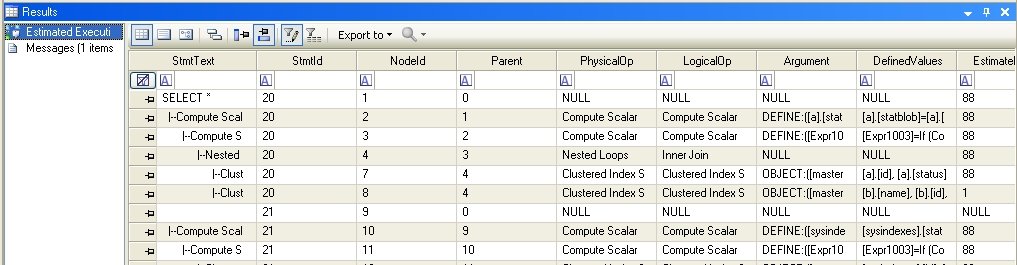
You can display execution plans in a grid or text format as well. Press the View as Grid icon to show the execution plan in a grid, as demonstrated in the image below.
To view the execution plan as text press the View as Text icon . This option is illustrated in the image below. If you wish to go back to the diagram-view of the execution plan then you should press the View as Diagram icon  .
.